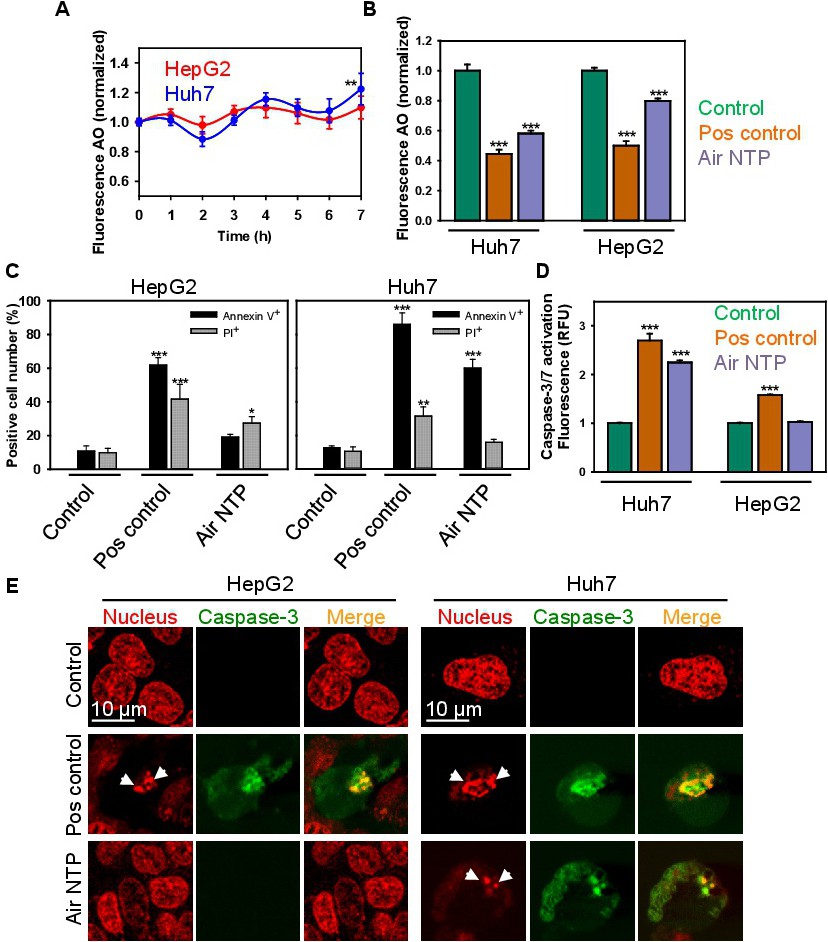
Fig. 6. Analysis of apoptosis hallmarks after NTP treatment. (A) Time-dependent and (B) long-term (8.5h post treatment) effects of NTP on lysosomal integrity. After plasma treatment (60 s) HepG2 and Huh7 cells were stained with acridine orange (AO). AO uptake in acidic lysosomes leads to red fluorescence, which dissipates when the dye leaves this compartment. The accompanying decrease in fluorescence intensity was analysed by spectrofluorometry. Readings were done in quadruplicates. As a positive control, cells were treated with 20 % ethanol for 30 min. The data present the mean values of four independent experiments. Data are expressed as means ± SEM (n = 4); **P< 0.01, ***P< 0.001. (C) Annexin V and propidium iodide (PI) quantification of plasma-treated Huh7 and HepG2. Cells were treated with NTP for 60 s, then 6 h after the treatment cells were labelled with Hoechst nuclear stain, annexin V and propidium iodide. Labelled cells were imaged with fluorescence microscopy. Annexin V and PI values were analysed with ImageJ (NIH). The data present mean values of five independent experiments. In each experiment 5 randomly selected fields for each sample were quantified. Data are expressed as means ± SEM (n = 5); *P< 0.05, **P< 0.01, ***P< 0.001. Positive control - 2 µM staurosporine for 4 h. (D) Caspase-3/7 activation assay in Huh7 and HepG2. Cells were stimulated with NTP for 60 s, then 6 h after the treatment cells were labelled CellEvent(tm) Caspase-3/7 Green Assay Kit. Following staining, cells were analysed using a fluorescent microplate reader. Readings were done in quadruplicates. As a positive control, cells were treated with 2 µM staurosporine for 4 h. The data present the mean values of four independent experiments. Data are expressed as means ± SEM (n = 4); ***P< 0.001. (E) Caspase-3/7 activation assay and nuclear fragmentation in Huh7 and HepG2. Cells were stimulated and labelled as in (D). Following staining, labelled cells were imaged with confocal microscopy. Representative images out of three independent experiments are shown. NucRed(tm) Live 647 ReadyProbes(tm) Reagent (red dye) was used for nucleus labelling. Positive control - 2 µM staurosporine for 4 h. White arrows indicate fragmented nuclei.